
J_Ecoacoust 2023, 7(1), 2; doi:10.35995/jea7010002
Article
Visualization and Quantification of the Activities of Animal Vocalizations in Forest Species Using Robot Audition Techniques
Hao Zhao 1,*,
Reiji Suzuki 1 ,
Shinji Sumitani 1,
Shiho Matsubayashi 2,
Takaya Arita 1,
Kazuhiro Nakadai 3
and
Hiroshi G. Okuno 4
,
Shinji Sumitani 1,
Shiho Matsubayashi 2,
Takaya Arita 1,
Kazuhiro Nakadai 3
and
Hiroshi G. Okuno 4
,
Shinji Sumitani 1,
Shiho Matsubayashi 2,
Takaya Arita 1,
Kazuhiro Nakadai 3
and
Hiroshi G. Okuno 4
1
Graduate School of Informatics, Nagoya University, Furo-cho, Chikusa-ku, Nagoya 464-8601, Japan; reiji@nagoya-u.jp (R.S.); sumitani@alife.cs.is.nagoya-u.ac.jp (S.S.); arita@nagoya-u.jp (T.A.)
2
School of Policy Studies, Kwansei Gakuin University, 2-1, Gakuen, Sanda, Hyogo 669-1337, Japan; matsubayashi@kwansei.ac.jp
3
Department of Systems and Control Engineering, School of Engineering, Tokyo Institute of Technology, 2-12-1, Ookayama, Meguro-ku, Tokyo 152-8552, Japan; nakadai@ra.sc.e.titech.ac.jp
4
Kyoto University, Japan, Yoshida-honmachi, Sakyo-ku, Kyoto 606-8501, Japan; okuno@ieee.org
*
Corresponding author: zhao.hao.y0@s.mail.nagoya-u.ac.jp
How to cite: Zhao, H.; Suzuki, R.; Sumitani, S.; Matsubayashi, S.; Arita, T.; Nakadai, K.; Okuno, H.G. Visualization and Quantification of the Activities of Animal Vocalizations in Forest Species Using Robot Audition Techniques. J. Ecoacoust. 2023, 7(1), 2; doi:10.35995/jea7010002.
Received: 7 June 2022 / Accepted: 5 April 2023 / Published: 7 December 2023
Abstract
:Ecoacoustics is a recent ecological discipline focusing on the ecological role of sounds. This study applies robot audition techniques and ecoacoustic methods in the visualization and quantification of forest animal vocalization, focusing mainly on inter-specific interactions between birds and cicadas. We adopt HARK, an open-source robot audition software, which enables us to estimate the direction of arrival of sound sources and their separated sounds using a microphone array unit. We focus on recordings in an experimental forest in Japan, where birds and cicadas dominate the soundscape. Cicada songs were further replayed at a regular interval repeatedly. We create a false-colour spectrogram based on the directions of arrival of sounds to grasp the individual-level dynamics of the soundscape of birds and cicadas in the recording. We further describe a method to classify their vocalizations using three ecoacoustic indices, then illustrate their temporal vocalization dynamics, measured as the total song duration in each time segment. We also conducted a quantitative analysis of their vocal activities to determine if there exist interactions among birds and cicadas, and the effects of replayed vocalizations of cicadas on them. The preliminary analysis implied that there might exist temporal overlap avoidance behaviours between birds and cicadas, and replayed songs of cicadas may reduce the activity of birds. We believe that this proof-of-concept observation and analysis can contribute to the further development of the fine-scale measurement of the biodiversity or habitat quality of environments based on the vocal activities of multiple species, while further detailed analysis is necessary.
Keywords:
robot audition techniques; ecoacoustics; acoustic indices; bird songs; cicada songs; vocal activity; HARKBirdIntroduction
Visualization and quantification are key techniques when considering the roles of sounds in ecoacoustics: a subject to understand their properties and functions in environments, and a tool for the indirect measurement of the biodiversity or habitat quality of environments (Farina and Gage, 2017). The acoustic localization of terrestrial wildlife using microphone arrays has long been recognized as a promising approach (Blumstein et al., 2011) and is now receiving considerable interest in bioacoustics (Rhinehart et al., 2020). Rhinehart et al. recently surveyed the applications of acoustic localization using autonomous recording units in terrestrial environments (Rhinehart et al., 2020), and pointed out that ecologists should make better use of acoustic localization; It can collect large-scale animal position data while minimizing the influence on the environment if recording hardware and automated localization and classification software are more available, and their algorithms improved for outdoor measurements.
Robot audition is a research field that focuses on developing technologies so that robots can hear sound through their own ears to understand real-world auditory environments (Nakdai and Okuno, 2020). Nakadai et al. developed an open-sourced robot-audition software, HARK (Honda Research Institute Japan Audition for Robots With Kyoto University) (Nakadai et al., 2010, 2017); It provides a rich set of sound source localization, separation and interface to permit automatic speech recognition with real-time processing and open-sourcing. HARK has been applied to the hearing capabilities of robots, human–robot interactions, search-and-rescue activities, and bird vocalization activity detection (Nakdai and Okuno, 2020).
Suzuki et al. developed a portable bird song detection system based on the sound source localization and separation of HARK, termed HARKBird (Suzuki et al., 2017; Sumitani et al., 2019). HARKBird enables users to record, estimate the timing, direction of arrival, and separate the sound of localized sources from recordings with microphone arrays deployed in a field, and further annotate the data (explained later). So far, HARKBird has been used to analyse the spatio-temporal patterns of the vocalizations (soundscape) of wild songbirds in field observations (Suzuki et al., 2018a), playback experiments (Suzuki et al., 2018b; Sumitani et al., 2021a), and observations of captive songbirds in a semi-free flight environment (Sumitani et al., 2021b). These techniques can be utilized to quantify the vocal activities of multiple classes of species to clarify their acoustic interactions, whereas acoustic localization techniques have not been tested or demonstrated for this purpose, as far as we know.
Visualizing soundscape dynamics can contribute to the analyses of inter- and intra-specific interactions, and the rapid biodiversity assessment of long-term recordings. Towsey et al. proposed a long-duration, false-colour spectrogram to detect species in large audio datasets (Towsey et al., 2014, 2018). They showed that the spectrogram coloured according to some acoustic indices (e.g., acoustic complexity index, ACI: estimates the abundance of species in a target soundscape, quantifying complex changes in the energy in the spectrogram of a recording (Pieretti et al., 2011)) allowing us to intuitively grasp changes in the dynamics of acoustic signals (e.g., changes in vocalizing species).
This study proposes a further application of robot audition techniques to soundscape visualization and the analysis of complex situations of vocalizing animals, including major species that dominate soundscapes in forests: birds and cicadas, using acoustic indices in ecoacoustics. We focus on recordings in the forest during early summer in Japan, where birds and cicadas sing and cicada songs were replayed at regular intervals. It has been reported that birds can adjust both the timing and frequency of their signals to reduce overlapping with the signals of other bird species (Cody and Brown, 1969; Brumm, 2006; Hart et al., 2021), other animals (Hart et al., 2015), and abiotic noise (Slabbekoorn and Peet, 2003), which supports the acoustic niche hypothesis (Krause, 1993).
First, inspired by Towsey et al. (Towsey et al., 2014, 2018), we create a false-colour spectrogram that visualizes the directional (DOA-based) soundscapes in which the colour of the spectrogram reflects the direction of the arrival of sounds, expecting to intuitively recognize the directional variations of acoustic events (e.g., different vocalizing individuals or an individual vocalizing at a different positions) (Suzuki et al., 2021). We then describe a method to classify their vocalizations using three ecoacoustic indices (acoustic complexity index, temporal entropy and acoustic cover) (Towsey et al., 2014, 2018). This allows us to illustrate patterns of their vocalization activities, measured as the total song duration in each time segment.
Materials and Methods
HARKBird
HARK is an open-sourced robot audition software consisting of multiple modules for sound source localization, separation, and automatic speech recognition of separated sounds that work on any robot with any microphone configuration (Nakadai et al., 2017; Nakdai and Okuno, 2020). This software platform provides a web-based interface, called HARK designer, to design a real-time signal processing software by composing a network of modules, each corresponding to signal processing. See the website of HARK for further details (https://hark.jp/).
HARKBird is a collection of Python scripts that enables us to conduct field recordings using microphone arrays connected to a laptop PC and analyse the recording using the HARK networks, which are designed to localize and separate bird songs in fields (Sumitani et al., 2019). The HARKBird can estimate the existence and the direction of arrival (DOA) of each sound source using the multiple signal classification (MUSIC) method (Schmidt, 1986) based on multiple spectrograms with short-time Fourier transformation.
When estimating the direction of arrival (DOA) of each sound source, HARKBird uses the directional information from the MUSIC method as an approximation of the structure of the soundscape in the directional domain. The MUSIC method (Schmidt, 1986) is a widely used high-resolution algorithm based on the eigenvalue decomposition of the correlation matrix of multiple signals from a microphone array. It separates the space spanned by the received signals into a noise subspace (spanned by low-rank eigenvectors) and a signal subspace (spanned by high-rank eigenvectors) to quantify how orthogonal a steering vector lies in the whole noise subspace, creating a MUSIC spectrum: the likelihood distribution of incoming sounds from the corresponding direction of arrival. There are various extensions of the MUSIC method, and several are implemented in HARK. We adopt one of the simplest called GSVD (generalized singular value decomposition).
We further extract separated sounds as wave files for each localized sound using the GHDSS (geometric high-order decorrelation) method (Nakajima et al., 2010). This also provides an interactive annotation tool as shown (Figure 1). The top panel shows a spectrogram. The bottom panel shows the corresponding MUSIC spectrum, and each rectangle represents the DOA and duration of a localized sound. The right panel shows a spectrogram of the separated sound indicated by the bold rectangle. A detailed description of HARKBird and the scripts are available in (Sumitani et al., 2019) and the website (http://www.alife.cs.is.nagoya-u.ac.jp/).
Figure 1.
Example of a spectrogram, a MUSIC spectrum and two separated sounds (cicada playback sound and bird sound) in the recording.
Figure 1.
Example of a spectrogram, a MUSIC spectrum and two separated sounds (cicada playback sound and bird sound) in the recording.

Recording and Playback Experiment
Study Area
We conducted playback experiments to observe the vocalizations of cicadas and birds in response to cicada songs replayed around their territories at our field site in the Inabu field, the experimental forest of the Field Science Center, Graduate School of Bioagricultural Sciences, Nagoya University, in central Japan (Figure 2).
The experimental procedure was approved by the planning and evaluation committee in the Graduate School of Informatics, Nagoya University (GSI-R2-1). The forest is mainly composed of a conifer plantation (Japanese cedar, Japanese cypress, and red pine), with small patches of broadleaf trees (quercus, acer, carpinus, etc.). In this area, the common bird and cicada species are known to vocalize during early summer. The Siberian blue robin (Larvivora cyane) was the species that mainly dominated the soundscape despite other bird species observed in this area (e.g., Blue-and-white Flycatcher (Cyanoptila cyanomelana), Brown-headed Thrush (Turdus chrysolaus), Eurasian Jay (Garrulus glandarius), Red-billed leiothrix (Leiothrix lutea), Eastern-crowned Warbler (Phylloscopus coronatus) and Japanese Bush Warbler (Horornis diphone)). There was a single species of cicadas (Terpnosia nigricosta).
Figure 2.
Experimental field, a recording node, and a speaker.

Playback Experiment
The recording system comprised the following components: a server node composed of a single laptop PC (XPS 13; Dell); a microphone node which had a microphone array (TAMAGO-03; System in frontier Inc.) connected with a Raspberry Pi 4, and a mobile battery (Figure 2). The server and microphone nodes were connected together by WiFi, enabling remote control of the node via a web-based interface. Additionally, the server node was connected to a loudspeaker via Bluetooth, allowing the server node to replay the recordings in the field via the speaker. We placed the microphone node and speaker in the field at known locations of songbirds and cicadas.
In terms of the playback sound, we adopted a field recording of ten minutes on 27 June 2020, in which multiple cicadas (Terpnosia nigricosta) vocalized through the recording (Figure 1). Noise reduction and normalization were applied to the .WAV file of a ten-minute recording using Audacity 2.1.2. We added an additional ten minutes of blank audio to produce twenty minutes of playback sound, which was looped on the server node without interruption until the end of the experiments. The level of each playback sound was approximately 85 dB (SPL) measured from one metre away, intended to make it sound clear enough to be recognized by individuals around the speaker.
We conducted experimental recordings on two consecutive days. The first recording started at 9:50 am and ended at 3:50 pm on 24 June 2021. The other recording started at 7:00 am and ended at 11:00 am on 25 June 2021. The playback experimental period started from 10:50 am on the first day, and started from 7:00 am on the second day.
Sound Source Localization and Separation
We used HARKBird to export the information on localized sound sources (i.e., the beginning and end time, DOA, and its separated sound file (.WAV file)). In this paper, we limited the frequency range for sound source localization to 2.5–3.5 kHz, to localize vocalizations of birds and cicadas around this range (Figure 1). This is because the vocalizations of birds and cicadas are shared within this frequency range. We also adjusted some default parameters in HARKBird to better localize these vocalizations, namely PERIOD and THRESH. We used a relatively small PERIOD (the interval between frames to perform sound source localization) (i.e., 0.1 sec. interval), to help localize the most vocalizations around the microphone array. When PERIOD , the temporal resolution of the localization process was large enough to accurately estimate the beginning and end time of the vocalizations of birds and cicadas because their durations were longer than this process interval. We also used THRESH (the detection threshold of the MUSIC spectrum values to recognize a sound source), to help to eliminate noise. We carefully set this parameter value so that HARK could localize target vocalizations while eliminating other fainter non-target sounds or noises.
Visualization of a Directional Soundscape with a False-Colour Spectrogram
We created a false-colour spectrogram to visualize a directional soundscape in which the colour reflects the direction of the arrival of sounds, expecting to intuitively recognize directional variations of acoustic events (Figure 3), according to the procedures as follows:
- A greyscale spectrogram is generated of the entire original recording, where the (brighter) greyscale values of each pixel reflect the (higher) energy at the corresponding time and frequency.
- A greyscale spectrogram is generated for each separated sound, and the pixels are extracted from the logarithm of the corresponding energy (normalized by the maximum value) higher than × the average value over the spectrogram. We used = 0.7 in this paper.
- A colour is chosen in a circular colour map that corresponds to the DOA of each separated sound.
- The chosen colour is assigned in (3) to the pixels of the spectrogram in (1), corresponding to the extracted pixels in (2).
We used this method to visualize four different situations: (a) active cicada vocalizations with playback sounds (11:30–11:40, 24 June); (b) active cicada vocalizations without playback sounds (13:00–13:10, 24 June); (c) and (d) active bird vocalizations (8:00–8:20, 25 June) with and without playback sounds.
Figure 3.
Overview of the directional spectrogram. (left) A circular colour map, (top right) directional spectrogram, and (bottom right) MUSIC spectrum (the likelihood of sound existence in the space of time and DOA).
Figure 3.
Overview of the directional spectrogram. (left) A circular colour map, (top right) directional spectrogram, and (bottom right) MUSIC spectrum (the likelihood of sound existence in the space of time and DOA).

Classification of Vocalizations Based on Acoustic Indices
Acoustic indices can reflect distinct attributes of soundscapes. We used the following three acoustic indices adopted in a visualization of soundscapes (Figure 4) with a false-colour spectrogram in (Towsey et al., 2014) to develop a method for bird/cicada song classification:
- Acoustic complexity index (ACI) (Pieretti et al., 2011): The average absolute fractional change in the amplitude values over time (complex vocalizations).
- Temporal entropy (H[t]) (Sueur et al., 2008): The normalized entropy of all the amplitude values (short repetitions of vocalizations over time).
- Acoustic cover (CVR) (Towsey et al., 2014): The fraction of the amplitude values where it exceeds a noise threshold (constant vocalizations over time).
We classified the localized sound sources into three classes (birds, cicadas, and noise) as follows (Figure 4):

Figure 4.
Automatic classification method based on the acoustic indices.
- A single separated source is focussed upon.
- For each index, the values for all the frequency bins are calculated (from 0.0 to 8.0 kHz with a bin size of 31.25 Hz) and normalized.
- The RCVR, the sum of the CVR values corresponding to the frequency range from 2.6 to 3.1 kHz, is calculated and further divided by the sum of the entire values. Then, the minimum values of ACI and H[t] are calculated corresponding to the frequency range from 4.0 to 6.0 kHz, called MACI and MH[t], respectively. The reason that we chose the MACI and MH[t] is because the vocalizations of birds and the short vocalizations of cicadas were detected in the frequency range 4.0–6.0 kHz, and the main frequency change the in short and sharp cicada vocalizations over the focal frequency range was clearer than bird vocalizations. This tendency can be reflected in relatively high minimal ACI or H[t] values in the cicada vocalizations. We set a threshold value for the sum of MACI and MH[t] to classify the short vocalizations of cicadas and birds, and the value worked well in this study.
- The focal sound source is classified by the criteria as follows: (0) If RCVR = 0 then noise, (1) else if RCVR >0.5 then cicadas (long and consistent vocalizations), (2) else if MH[t]+MACI >1.4 then cicadas (short and sharp vocalizations), (3) otherwise birds.
We classified the localized sound sources into two 10 min recordings using the above classification method, and manually checked the classification results.
Vocal Activity Analysis
We quantified the temporal changes in the vocal activities of birds and cicadas to observe the inter-specific interactions between birds and cicadas. Their activity in each 50 s or 150 s time segment was calculated as the total duration of the localized sounds in the segment. We then divided the values of the vocal activities into four groups: vocal activities of cicadas with or without playback (of cicada vocalizations), vocal activities of birds with or without playback. We used the K-S (Kolmogorov–Smirnov) test to determine if there were significant differences among them. We also conducted a correlation analysis of the bird and cicada vocal activities to obtain implications on the temporal avoidance behaviours between these species.
In this study, we focused on three recording scenarios (S1–S3) to demonstrate the significance of the proposed approaches, as summarized in Figure 5 and Table 1. With S1, we focussed on effects of replayed cicada songs on the vocal activities of birds under no (real) cicada vocalizations in the morning. With S2, we focussed on the mutual effects between the active vocalizations of birds and cicadas under the replayed playback of cicadas.
For S1 and S2, we manually annotated the vocalization events of cicadas and birds (directional information and vocal duration) by conducting auditory and visual inspections of the automatically generated localization and classification results. We added mislocalized songs of birds and removed other unnecessary sounds, such as short bird calls and noise, to make the annotation process as fair as possible between the duration with and without cicada playback. While there were still some faint and unclear vocalizations, we believe we successfully captured the vocalization of major individuals around the microphone.
S3 focused on a long-term recording that included situations similar to S1 and S2. We discussed the temporal dynamics of the vocal activities using the automatically localized and classified results. We excluded sounds localized in the range of 80 and 120 degrees around the DOA of replayed sounds for a fair comparison of activities between the playback and non-playback cases because replayed sounds came from approximately 100 degrees. However, we rarely observed vocalizations in these ranges of degrees.
Figure 5.
The types of target interactions among cicadas and birds in each recording analysis S1–S3.
Figure 5.
The types of target interactions among cicadas and birds in each recording analysis S1–S3.


Table 1.
Case studies.
| Period | Scenario | Target Interactions |
|---|---|---|
| (S1) 7:00–9:30, 25 June | Active vocalization of birds but not cicadas | Effects of replayed cicada vocalizations on bird individuals (with manually annotated data) |
| (S2) 11:50–12:50, 24 June | Active vocalization of birds and cicadas | Inter-specific interactions between birds and cicadas, and effects of replayed cicada vocalizations (with manually annotated data) |
| (S3) 9:50–15:40, 24 June | Long-term dynamics of vocalization of cicadas and birds with replayed cicada vocalizations (with automatically classified data) |
Results
Directional Soundscape
Figure 6 illustrates the directional soundscapes of birds and cicadas, showing that Siberian blue robins (Larvivora cyane) and cicadas (Terpnosia nigricosta) dominated the soundscape. Each panel corresponds to a 10 min recording. In (a), the figure shows the clear vocalizations of birds without playback. We observed that the colours, which reflect the directions of their localized sound, change alternately. This may imply that two or three individual birds were alternately vocalizing during the recording. In (b) and (c), which are soundscapes of cicadas without and with playback, the coloured regions are concentrated in the intermediate frequency range at approximately 2.5–3.5 kHz. This reflects the typical frequency range of cicada vocalizations. We also identified coloured regions of light purple appearing for long time periods in (c). This reflects that the playback sounds came from the azimuth of approximately 100 degrees. As for (d), it shows the vocalizations of cicadas and birds without playback. We observed that multiple cicadas and few birds vocalized during this recording.
Figure 6.
Two directional soundscapes of cicadas and birds for ten minutes. (a) birds, no playback; (b) cicadas, no playback; (c) cicadas, playback; (d) birds and cicadas, no playback.
Figure 6.
Two directional soundscapes of cicadas and birds for ten minutes. (a) birds, no playback; (b) cicadas, no playback; (c) cicadas, playback; (d) birds and cicadas, no playback.

Classification of Vocalizations Based on an Acoustic Index
We classified the localized sound sources for two 20 min recordings using the proposed automatic classification method, and manually checked whether the classification results were correct. The statistical results are shown in Figure 7. The left graph is from the recording of 11:50–12:00 on 24 June, and the right is from the recording of 12:30–12:40 on 24 June. For the group of sounds classified into each category, we checked whether the classification of each sound was correct or not. The classification accuracy for the localized sound of the two recordings was higher than 80%. The accuracy of the classification of the localized sound was 83.9% in total from the 20 min recordings. Based on this result, we believe that our classification can be applied to the classification of cicada and bird sounds from more recordings in this experiment.
Figure 7.
Bar charts of the classification results of the sounds of cicadas, birds, and noise from a 20 min recording.
Figure 7.
Bar charts of the classification results of the sounds of cicadas, birds, and noise from a 20 min recording.

Vocal Activity Analyses
S1: Effects of Replayed Cicada Vocalizations on Individual Birds
Based on our field observations, we expected that replayed cicada vocalizations may influence the vocalizations of individual birds. To observe the vocal activity of birds and quantify the effects of replayed cicada vocalizations on them, we used the annotated results of bird vocalizations for two hours and thirty minutes (7:00 am to 9:30 am, 25 June) because there were almost no cicada vocalizations in the field during this period. The soundscape was mostly composed of songs of the Siberian blue robin (Larvivora cyane), with songs of the Brown-headed Thrush (Turdus chrysolaus) and a few calls of the Eurasian Jay (Garrulus glandarius) as well. The vocal activity of birds in each 150 s time segment was calculated as the total duration of the localized sounds in the segment.
Figure 8 shows (A) the temporal changes in the vocal activity of the birds (red) with and without the playback conditions (light blue), and (B) the boxplot of the vocal activity. (C) shows the directional distribution of bird vocalizations, showing that this bird soundscape was dominated by approximately three individuals. In (A), the vocal activity of birds dynamically changed through the recording and birds vocalized more actively in the conditions without playback. (B) The box plot and K-S test result (<0.001) for the vocal activity of birds also explains that the vocal activity of birds in the no playback conditions was significantly larger than in the playback conditions.
Figure 8.
Vocal activity of birds at two hours and thirty minutes.

S2: Inter-Specific Interactions Between Birds and Cicadas, and the Effects of Replayed Cicada Vocalizations
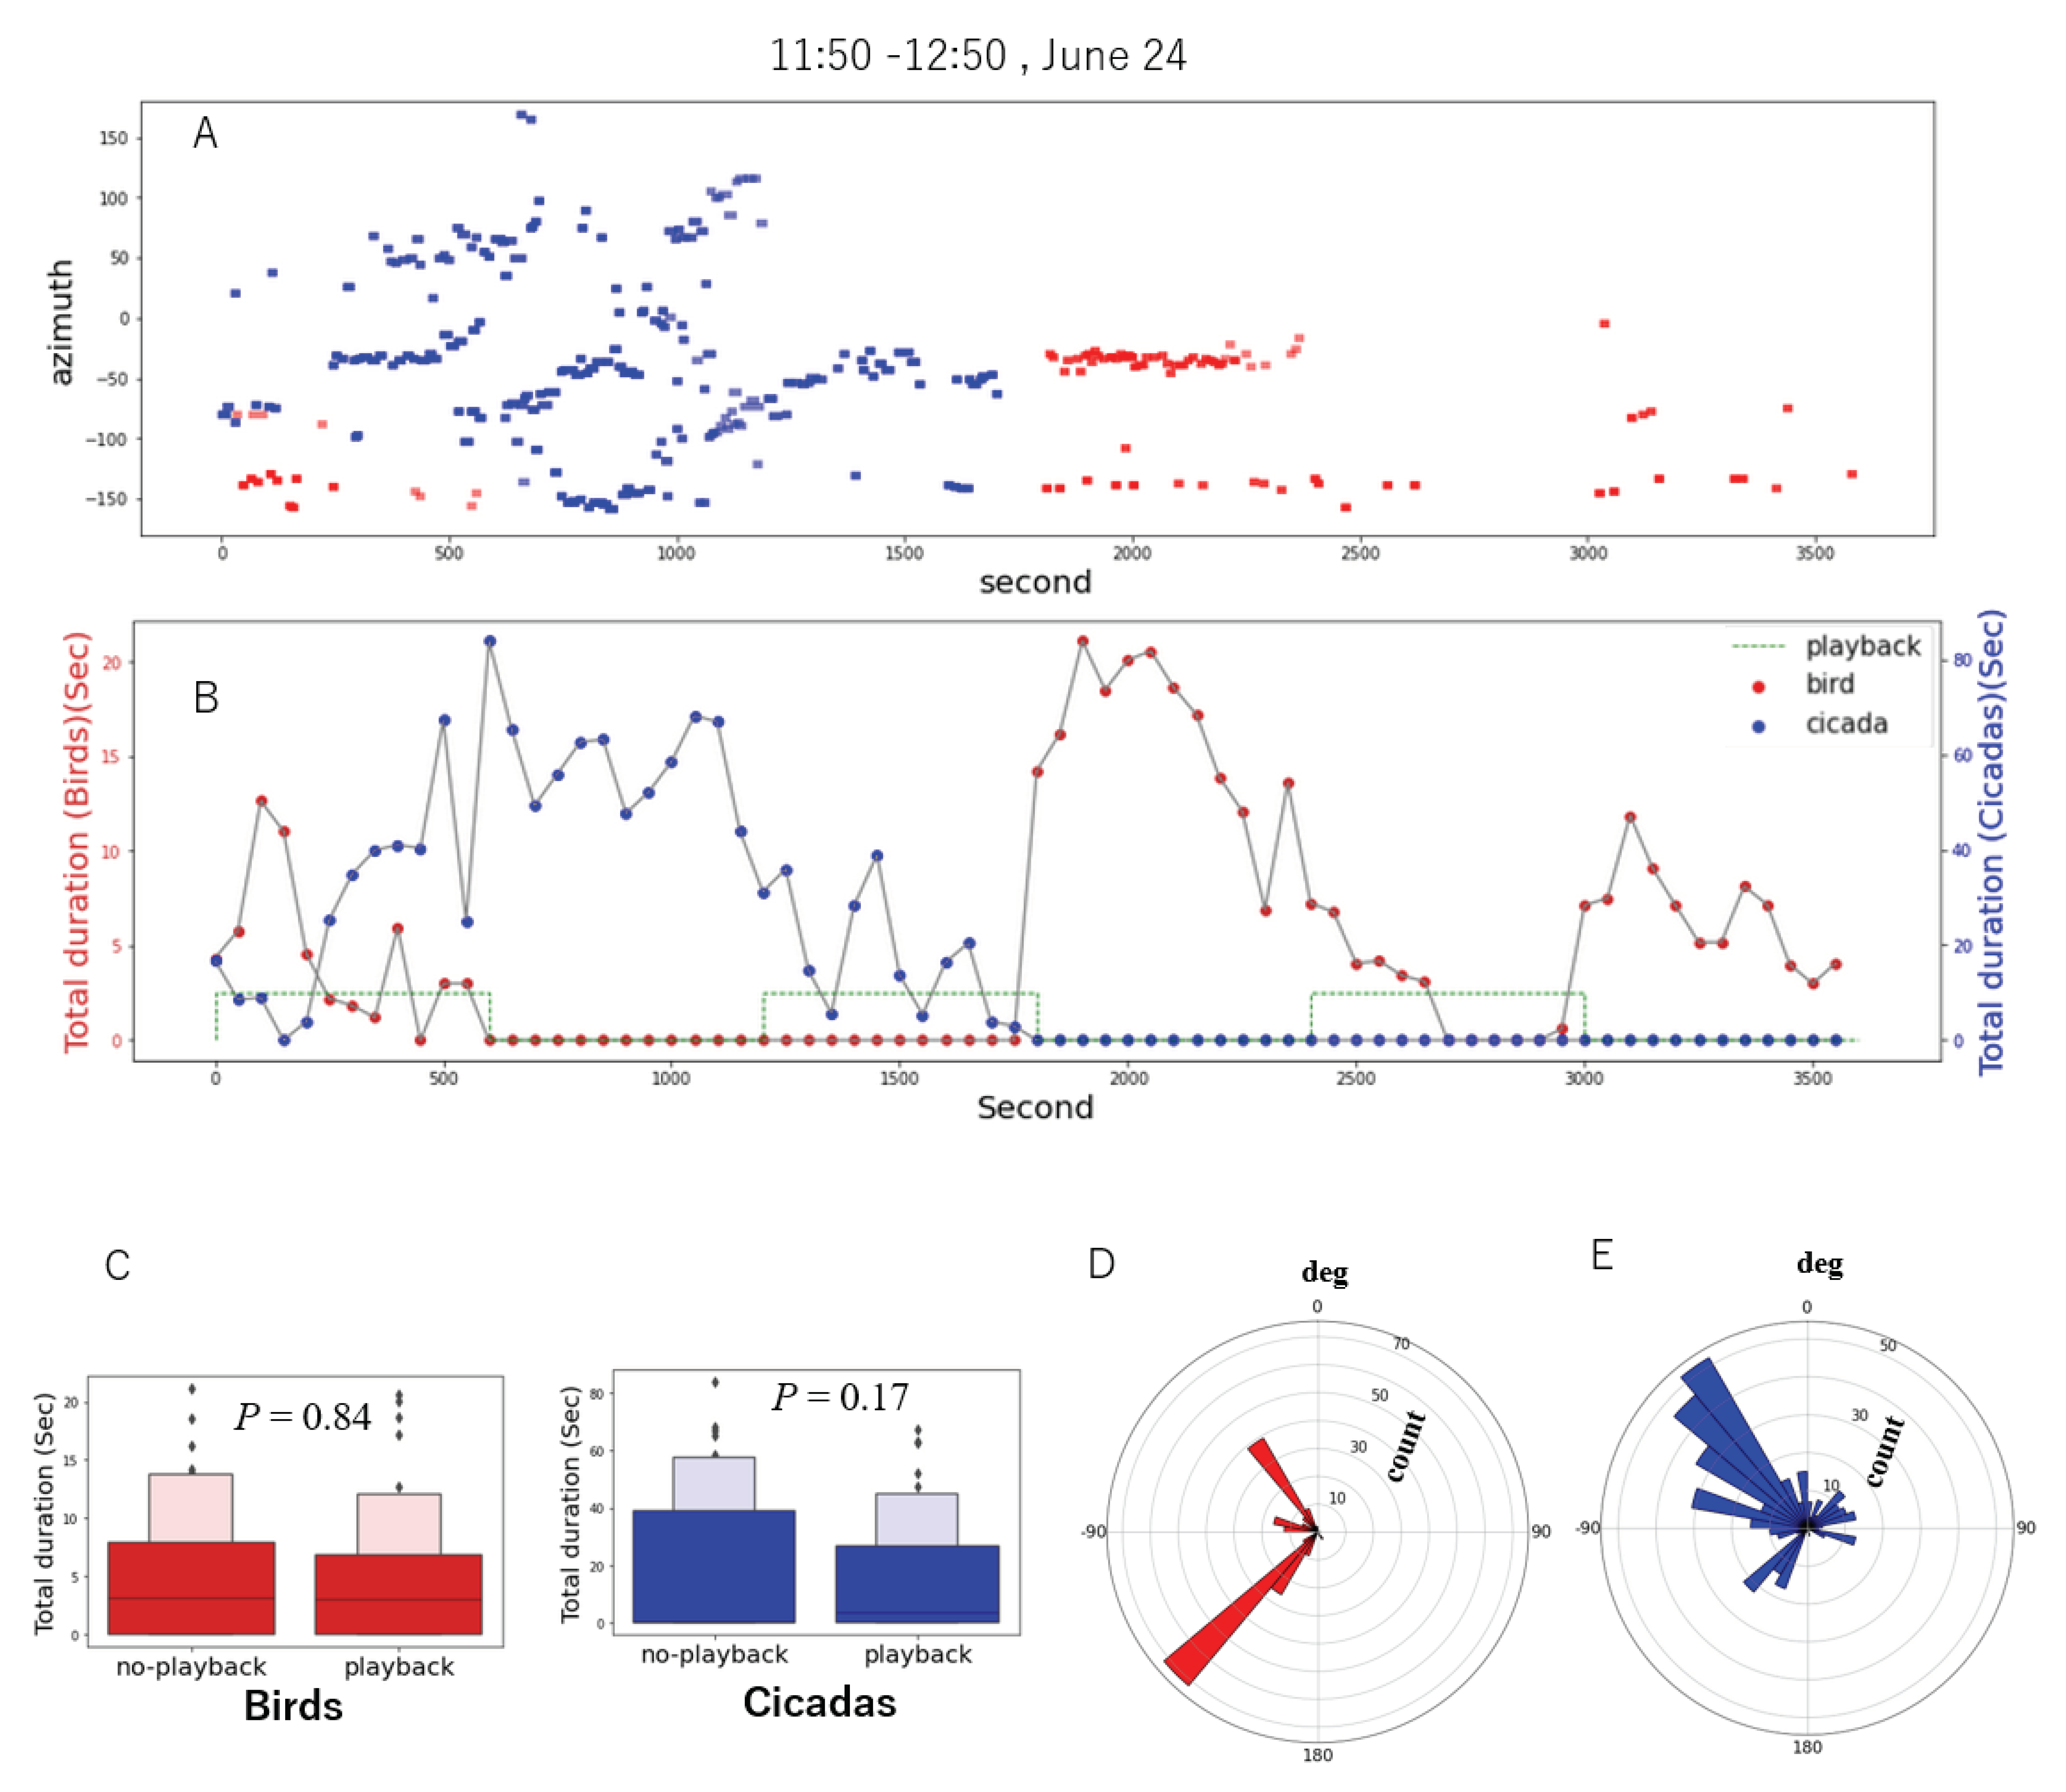
A chorus of cicadas is a well-known self-organizing behaviour of the vocal activities of multiple cicadas (Fonseca, 2014), and their detailed dynamics has been discussed recently (Sheppard et al., 2020). To elaborate on the short-term dynamics of bird and cicada vocalizations, focusing on a cicada chorus, we manually annotated and analyzed the vocal activity of a 1 h recording (11:50–12:50, 24 June). Siberian blue robins (Larvivora cyane) and cicadas (Terpnosia nigricosta) dominated the soundscape in this recording. The activity of cicadas and birds in each 50 s time segment was calculated as the total duration of the localized sounds in the segment. We annotated the vocalizations of the individual cicadas and birds of the localized sound sources by manual inspection.
Figure 9 shows the results of the vocal activity analysis: (A) The distribution of vocalizations in the space of time and direction of arrival; (B) the temporal changes in the vocal activity of birds and cicadas; (C) the box plot of their vocal activity; (D) and (E) the directional distribution of individual birds and cicadas. In (A), the red and blue bars represent the vocalizations of the birds and cicadas, respectively. We observed that multiple individual cicadas were vocalizing during the recording because their vocalizations were localized in various directions and when the cicadas vocalized actively while the birds were quiet (e.g., 500–1500 s). We also found that a single cicada started singing (e.g., 300–500 s) and multiple individuals followed and sang together actively (e.g., 500–1000 s). Then, the cicadas were gradually getting quiet in the latter half of the recording, and birds began to sing again. In (B), we can also observe the temporal overlap avoidance behaviour between the birds and cicadas in terms of their activities (e.g., 500–1000 s and 1500–2000 s). The box plot (C) also illustrates that the activities of the vocalizations of the cicadas and birds were not significantly dependent on the playback conditions, implying that the observed self-organizing behaviour of cicadas was dynamics in this period. (D) and (E) show that this bird soundscape was dominated by two individuals singing at approximately −140 degrees and −45 degrees. The individual cicadas at approximately −40 degrees vocalized more actively in this 1 h recording.
Figure 9.
Vocal activity of birds (red) and cicadas (blue) after manual annotation of approximately 1 h.
Figure 9.
Vocal activity of birds (red) and cicadas (blue) after manual annotation of approximately 1 h.
Furthermore, to quantitatively analyse the inter-specific interactions of the cicadas and birds, we analysed the correlation between the activities of birds and cicadas (Figure 10). The result (left) shows the correlation between the vocalization activities between birds and cicadas in this recording. The x and y axes represent the total duration of the cicada and bird vocalizations in each 50 s time segment, respectively. The coefficient (−0.50) may imply that the birds tended to avoid vocalizing with the cicadas, at least in this particular example recording. Additionally, the result (right) also shows the distribution of the duration per vocalization of cicadas in the 1 h recording. This distribution reflects the property of the vocalizations of cicadas, whose vocalizations are composed of repetitions of introductory short sounds and subsequent main song components. The left higher peak shows that there is a considerable number of short calls of cicadas in the recording.
Figure 10.
Correlation between the vocal activities of birds and cicadas in 1 h (left); the distribution of the duration per vocalization of cicadas (right).
Figure 10.
Correlation between the vocal activities of birds and cicadas in 1 h (left); the distribution of the duration per vocalization of cicadas (right).

S3: Long-Term Dynamics of the Vocalization of Cicadas and Birds with Replayed Cicada Vocalizations
Finally, we focused on the long-term vocal activities of birds and cicadas. We classified the localized sound sources of approximately 6 h daytime recordings using the proposed automatic classification method to extract the vocalizations of birds and cicadas to analyse their vocal activity during daytime. Siberian blue robins (Larvivora cyane) and cicadas (Terpnosia nigricosta) dominated the soundscape in this recording. Their activity in each 150 s time segment was calculated as the total duration of the localized sounds in the segment (Figure 11).
Figure 11A illustrates the changes in the vocal activity of the cicadas (blue) and birds (red) through the 6 h recording. We observed that their activities changed through the day in that they were active until around 2 pm and the cicadas were quiet after this time. We classified the entire recording into three periods: P1: active vocalization without playback, P2: active vocalizations with playback, and P3: bird vocalizations with playback. The situations of P2 and P3 correspond to S2 and S1, respectively. The result also illustrates the correlation between the vocal activities and the differences with and without playback in the corresponding periods, respectively (Figure 11B,C). Furthermore, the activity of cicadas can also be reduced by replaying the cicada songs.
In P1, we observed that both birds and cicadas actively sang under no playback conditions, and the correlation analysis shows that there was a weak negative relationship between their activities. We also find a similar tendency in P2, which fits with the result in S2. These imply that they might be avoiding temporal overlap with each other. We also observe that their activities tended to be high in the case of no playback but only significant for cicadas. However, the birds tended to be significantly more active in the no playback conditions in P3, also fitting with the tendency in S1. This implies that the birds tended to respond more clearly to replayed vocalizations in more quiet conditions.
While all results were based on the automatic classifications of a single day recording, they indicate the applicability of our approach to quantitatively grasp and analyse the dynamics of multi-species vocal activities.
Figure 11.
Vocal activity of birds (red) and cicadas (blue) based on the proposed classification for approximately 6 h.
Figure 11.
Vocal activity of birds (red) and cicadas (blue) based on the proposed classification for approximately 6 h.

Discussion
We proposed two novel contributions of robot audition techniques to ecoacoustics: directional soundscape visualization and the vocal activity quantification of forest animals. As a proof-of-concept, we focused on recordings in an experimental forest in Japan, where birds and cicadas dominate the soundscape; cicada songs were repeatedly played at a regular interval.
Visualizing the soundscape can contribute to analyses of vocal interactions among species and individuals, and the rapid biodiversity assessment of long-term recordings. As a seminal example, the false-colour spectrogram for long-durations proposed by Towsey et al. (2014) enabled users to identify species in large audio datasets and intuitively grasp the changes in dynamics of the acoustic signals by showing the spectrogram coloured according an acoustic index, which reflects the specific properties of the species vocalizations. Brodie et al. (2022) further explored the efficacy of using false-colour spectrograms to identify multiple frog species in long-duration recordings and obtained data on the chorusing activity of the frog community. They found that frog choruses of different species could be visually identified with high accuracy in false-colour spectrogams based on acoustic indices after a training phase. Additionally, the application of the latent space visualization of communication signals is also receiving considerable attention in the field of bioacoustics. Sainburg proposed a Python package, called the animal vocalization generative network (AVGN) (Sainburg et al., 2019), reporting various examples of the use of the latent space such as discrete latent projections of animal vocalizations and temporally continuous latent trajectories. These approaches focused on the acoustic properties in the time–frequency domain. Our method adds a novel dimension to the visualization approaches by mapping the direction of the arrival of sound sources to the colours of the corresponding areas in the spectrograms. This can illustrate a different type of diversity in the spectrograms. We observed the distributions of colours and their changes in the spectrograms and recognized their spectral properties, enabling us to grasp the directional distribution of vocalizations and their acoustic properties at one time even if their patterns were the same (i.e., a unique species).
A population of vocalizing animals can be recognized as a complex system in that they are mutually interacting with each other via vocal signals, creating their own soundscape dynamics. However, it is not straightforward to observe the detailed dynamics of animal vocalization behaviours in the field. Particularly, when analysing the inter-specific relationships in the field, the classification of their sound events is challenging. As an approach to combine robot audition techniques with ecoacousic analysis, we used three acoustic indices to classify the separated sounds by HARKBird into bird vocalizations, cicada vocalizations, and noise. While the procedure was hand-coded, the accuracy of the classification of the localized sound was 83.9% in total from the 20 min recordings. Brown et al. (2019) proposed a classification approach using acoustic indices and MFCCs to filter noise from rain and cicada choruses in recordings containing bird sounds. The method can detect cicada choruses in the training set with 100% accuracy based on random forest with MFCCs. Noda et al. (2019) introduced a classification system of insect chants through a data fusion of mel and lineal cepstral coefficients based on an SVM algorithm, showing a success classification rate of 98.07% of 343 insect species. Such machine learning techniques can significantly increase the accuracy of the proposed method.
Another benefit of our approach is the fine-scale or individual-level estimation of the vocal activities of species. While there have been various empirical studies on the temporal partitioning or overlap avoidance of the singing behaviours of songbirds and cicadas with various time scales (Cody and Brown, 1969; Ficken et al., 1974; Brumm, 2006; Araya-Salas et al., 2017; Suzuki et al., 2018b; Sueur, 2002), there have still been few studies showing that birds vocalize avoiding cicadas. Hart et al. showed that birds significantly avoid temporal overlap with cicadas by reducing and often shutting down vocalizations at the onset of cicada signals that utilize the same frequency range (Hart et al., 2015). As example scenarios to consider the applicability of our method, we quantified the vocal activities of birds and cicadas in three recording scenarios in the forest. We observed the temporal changes in their vocalization activities through the recordings. While all were implicated from a few recording trials, the results shows there might exist a weak tendency of temporal overlap avoidance behaviours between birds and cicadas. They might avoid such an overlap because the focal species share a similar frequency, according to acoustic niche hypothesis (Krause, 1993), but more detailed investigations are necessary.
We also analysed the effects of replayed cicada songs on their vocalization activities. Birds avoided overlap with replayed cicada songs when their conditions were quiet, but they did not around periods of chorus or collective vocalizations of the cicadas. Cicadas may also avoid overlap with replayed songs of conspecifics in some cases. However, there is a possibility that the replayed sounds were merely recognized as artificial sounds that have a similar frequency range to their vocalizations. The cicada chorus was recently evaluated with large-scale spatial recordings collected using many smartphones as a citizen science project (Sheppard et al., 2020) to observe the spatio-temporal pattern of the oscillating amplitudes of cicada (Magicicada cassini) chorus in trees. It was shown that high levels of illumination correlate with faster, larger magnitude, and more spatially synchronous cicada chorus volume fluctuations. The active and collective vocalizations of cicadas observed in P2 until 2 pm in S3 might be induced by such a change in the brightness in the forest because the field was surrounded by many tall and planted coniferous trees making the site darker. Our approach based on microphone arrays enables us to observe individual behaviours of cicada vocalization patterns, which may further contribute to understanding the fine-scale dynamics of their interactions.
Recently, approaches based on ecoacoustic indices are becoming more importance in ecological surveys and conservations (Farina et al., 2021). Additionally, there is interest in the application of complex systems to ecoacoustics for conservation studies (Eldridge, 2021). We believe that our approach based on the fine-scale or individual-level quantification of acoustic activities can contribute to the integration of such multi-disciplinary approaches because understanding the ecological phenomenon as an emergent behaviour arising from local interactions is a key concept in this research field.
Future work includes the application of machine learning techniques to classification algorithms, and conduct a long-term (e.g., a month) visualization and analysis of bird and cicada vocalizations to further consider the implications obtained from this proof-of-concept analysis.
Author Contributions
H.Z., R.S., S.S. and T.A. designed and H.Z., R.S. and S.S. conducted field experiments in Inabu. S.M. advised on the ecological aspects of the field environments. K.N. and H.G.O. advised on the development of the experimental system including HARKBird. H.Z. and R.S. analysed the results and wrote the manuscript with support from all authors.
Funding
This work was supported in part by JSPS/MEXT KAKENHI: JP21K12058, JP20H00475, JP19KK0260, and JP17H06383 in 4903 (Evolinguistics).
Data Availability Statement
Data supporting the findings of this study are available in the Dryad digital repository https://doi.org/10.5061/dryad.j3tx95xhh.
Acknowledgments
We thank Naoki Takabe (Nagoya University) for supporting the field experiments. The author (H.Z.) would like to take this opportunity to thank the “Nagoya University Interdisciplinary Frontier Fellowship” supported by Nagoya University and JST, the establishment of university fellowships towards the creation of science technology innovation, Grant Number JPMJSP2125.
Conflicts of Interest
The authors declare no conflict of interest.
References
- Araya-Salas, M.; Wojczulanis-Jakubas, K.; Phillips, E. M.; Mennill, D. J.; Wright, T. F. To overlap or not to overlap: Context-dependent coordinated singing in lekking long-billed hermits. Animal Behaviour 2017, 124, 57–64. [Google Scholar] [CrossRef]
- Blumstein, D.; Mennill, D. J.; Clemins, P.; Girod, L.; Yao, K.; Patricelli, G.; Deppe, J. L.; Krakauer, A. H.; Clark, C.; Cortopassi, K. A.; Hanser, S. F.; McCowan, B.; Ali, A. M.; Kirshel, A. N. G. Acoustic monitoring in terrestrial environments using microphone arrays: Applications, technological considerations and prospectus. Journal of Applied Ecology 2011, 48, 758–767. [Google Scholar] [CrossRef]
- Brodie, S.; Towsey, M.; Allen-Ankins, S.; Roe, P.; Schwarzkopf, L. Using a novel visualization tool for rapid survey of long-duration acoustic recordings for ecological studies of frog chorusing. Frontiers in Ecology and Evolution 2022, 9, 761147. [Google Scholar] [CrossRef]
- Brown, A.; Garg, S.; Montgomery, J. Automatic rain and cicada chorus filtering of bird acoustic data. Applied Soft Computing 2019, 81, 105501. [Google Scholar] [CrossRef]
- Brumm, H. Signalling through acoustic windows: nightingales avoid interspecific competition by short-term adjustment of song timing. Journal of Comparative Physiology A: Neuroethology 2006, 192, 1279–1285. [Google Scholar] [CrossRef] [PubMed]
- Cody, M. L.; Brown, J. H. Song asynchrony in neighbouring bird species. Nature 1969, 222(5192), 778–780. [Google Scholar] [CrossRef]
- Eldridge, A. Listening to ecosystems as complex adaptive systems: Toward acoustic early warning signals. In Proceedings of the ALIFE 2021: The 2021 Conference on Artificial Life, Online, July 18–22; 2021. isal_a_00450, 20. [Google Scholar]
- Farina, A.; Gage, S. H. Ecoacoustics: The Ecological Role of Sounds; John Wiley and Sons: Hoboken, 2017. [Google Scholar]
- Farina, A.; Righini, R.; Fuller, S.; Li, P.; Pavan, G. Acoustic complexity indices reveal the acoustic communities of the old-growth Mediterranean forest of Sasso Fratino Integral Natural Reserve (Central Italy). Ecological Indicators 2021, 120, 106927. [Google Scholar] [CrossRef]
- Ficken, R. W.; Ficken, M. S.; Hailman, J. P. Temporal pattern shifts to avoid acoustic interference in singing birds. Science 1974, 183(4126), 762–763. [Google Scholar] [CrossRef]
- Fonseca, P. J. Cicada acoustic communication. In Insect Hearing and Acoustic Communication; Hedwig, B., Ed.; Springer: Berlin, 2014; pp. 101–121. [Google Scholar]
- Hart, P. J.; Hall, R.; Ray, W.; Beck, A.; Zook, J. Cicadas impact bird communication in a noisy tropical rainforest. Behavioral Ecology 2015, 26(3), 839–842. [Google Scholar] [CrossRef]
- Hart, P. J.; Paxton, K.; Ibanez, T.; Tredinnick, G.; Sebastián-González, E.; Tanimoto-Johnson, A. Timing is everything: Acoustic niche partitioning in two tropical wet forest bird communities. Frontiers in Ecology and Evolution 2021, 9, 753363. [Google Scholar] [CrossRef]
- Krause, B. L. The niche hypothesis: a virtual symphony of animal sounds, the origins of musical expression and the health of habitats. The Soundscape Newsletter 1993, 6, 6–10. [Google Scholar]
- Nakadai, K.; Okuno, H. G.; Mizumoto, T. Development, deployment and applications of robot audition open source software HARK. Journal of Robotics and Mechatronics 2017, 29(1), 16–25. [Google Scholar] [CrossRef]
- Nakadai, K.; Takahashi, T.; Okuno, H. G.; Nakajima, H.; Hasegawa, Y.; Tsujino, H. Design and implementation of robot audition system “HARK”—Open source software for listening to three simultaneous speakers. Advanced Robotics 2010, 24(5–6), 739–761. [Google Scholar] [CrossRef]
- Nakajima, H.; Nakadai, K.; Hasegawa, Y.; Tsujino, H. Blind source separation with parameter-free adaptive step-size method for robot audition. IEEE Transactions on Audio, Speech, and Language Processing 2010, 18(6), 1476–1485. [Google Scholar] [CrossRef]
- Nakdai, K.; Okuno, H. G. Robot audition and computational auditory scene analysis. Advanced Intelligent Systems 2020, 2(9), 2000050. [Google Scholar] [CrossRef]
- Noda, J. J.; Travieso-González, C. M.; Sánchez-Rodríguez, D.; Alonso-Hernández, J. B. Acoustic classification of singing insects based on MFCC/LFCC fusion. Applied Sciences 2019, 9(19), 4097. [Google Scholar] [CrossRef]
- Pieretti, N.; Farina, A.; Morri, D. A new methodology to infer the singing activity of an avian community: The Acoustic Complexity Index (ACI). Ecological Indicators 2011, 11(3), 868–873. [Google Scholar] [CrossRef]
- Rhinehart, T. A.; Chronister, L. M.; Devlin, T.; Kitzes, J. Acoustic localization of terrestrial wildlife: Current practices and future opportunities. Ecology and Evolution 2020, 10(13), 6794–6818. [Google Scholar] [CrossRef]
- Sainburg, T.; Thielk, M.; Gentner, T. Animal vocalization generative network (AVGN): A method for visualizing, understanding, and sampling from animal communicative repertoires. In Proceedings of the 41th Annual Meeting of the Cognitive Science Society, Montreal, QC, Canada, July 24–27; 2019; p. 3563. [Google Scholar]
- Schmidt, R. Multiple emitter location and signal parameter estimation. IEEE Transactions on Antennas and Propagation 1986, 34(3), 276–280. [Google Scholar] [CrossRef]
- Sheppard, L. W.; Mechtley, B.; Walter, J. A.; Reuman, D. C. Self-organizing cicada choruses respond to the local sound and light environment. Ecology and Evolution 2020, 10(10), 4471–4482. [Google Scholar] [CrossRef]
- Slabbekoorn, H.; Peet, M. Birds sing at a higher pitch in urban noise. Nature 2003, 424, 267. [Google Scholar] [CrossRef] [PubMed]
- Sueur, J. Cicada acoustic communication: potential sound partitioning in a multispecies community from mexico (hemiptera: Cicadomorpha: Cicadidae). Biological Journal of the Linnean Society 2002, 75(3), 379–394. [Google Scholar] [CrossRef]
- Sueur, J.; Pavoine, S.; Hamerlynck, O.; Duvail, S. Rapid acoustic survey for biodiversity appraisal. PLoS ONE 2008, 3(12), e4065. [Google Scholar] [CrossRef] [PubMed]
- Sumitani, S.; Suzuki, R.; Matsubayashi, S.; Arita, T.; Nakadai, K.; Okuno, H. G. Fine-scale observations of spatio-spectro-temporal dynamics of bird vocalizations using robot audition techniques. Remote Sensing in Ecology and Conservation 2021a, 7(1), 18–35. [Google Scholar] [CrossRef]
- Sumitani, S.; Suzuki, R.; Arita, T.; Nakadai, K.; Okuno, H. G. Non-invasive monitoring of the spatio-temporal dynamics of vocalizations among songbirds in a semi free-flight environment using robot audition techniques. Birds 2021b, 2(2), 158–172. [Google Scholar] [CrossRef]
- Sumitani, S.; Suzuki, R.; Matsubayashi, S.; Arita, T.; Nakadai, K.; Okuno, H. G. An integrated framework for field recording, localization, classification and annotation of birdsongs using robot audition techniques—Harkbird 2.0. In Proceedings of the 2019 IEEE International Conference on Acoustics, Speech and Signal Processing (ICASSP 2019), Brighton, UK, May 12–17; 2019; pp. 8246–8250. [Google Scholar]
- Suzuki, R.; Headley, R.; Matsubayashi, S.; Nakadai, K.; Okuno, H. G. HARKBird: Exploring acoustic interactions in bird communities using a microphone array. Journal of Robotics and Mechatronics 2017, 29(1), 213–223. [Google Scholar] [CrossRef]
- Suzuki, R.; Matsubayashi, S.; Saito, F.; Murate, T.; Masuda, T.; Yamamoto, Y.; Kojima, R.; Nakadai, K.; Okuno, H. G. A spatiotemporal analysis of acoustic interactions between great reed warblers (Acrocephalus arundinaceus) using microphone arrays and robot audition software HARK. Ecology and Evolution 2018a, 8(1), 812–825. [Google Scholar] [CrossRef]
- Suzuki, R.; Sumitani, S.; Naren, Matsubayashi, S.; Arita, T.; Nakadai, K.; Okuno, H. G. Field observations of ecoacoustic dynamics of a Japanese bush warbler using an open-source software for robot audition HARK. Journal of Ecoacoustics 2018b, 2, 9. [Google Scholar] [CrossRef]
- Suzuki, R.; Hao, Z.; Sumitani, S.; Matsubayashi, S.; Arita, T.; Nakadai, K.; Okuno, H. G. Visualizing directional soundscapes of bird vocalizations using robot audition techniques. In Proceedings of the 2021 IEEE/SICE International Symposium on System Integrations (SII 2021), Online, January 11–14; 2021; pp. 487–492. [Google Scholar]
- Towsey, M.; Zhang, L.; Cottman-Fields, M.; Wimmer, J.; Zhang, J.; Roe, P. Visualization of long-duration acoustic recordings of the environment. Procedia Computer Science 2014, 29, 703–712. [Google Scholar] [CrossRef]
- Towsey, M.; Znidersic, E.; Broken-Brow, J.; Indraswari, K.; Watson, D. M.; Phillips, Y.; Truskinger, A.; Roe, P. Long-duration, false-colour spectrograms for detecting species in large audio data-sets. Journal of Ecoacoustics 2018, 2, 6. [Google Scholar] [CrossRef]
© 2023 by the authors. Licensed as an open access article using a CC BY 4.0 license.